
Onward & Upward: An Update on China and the Global Innovation Index

Photo: xtock /Adobe Stock
Economist Bill Nordhaus once referred to gross domestic product (GDP) as one of the “greatest inventions of the twentieth century.” It is hard to imagine, in 2017, that Presidents Hoover and later Roosevelt employed measures as sketchy as freight car load capacity and stock price indices to design policies to combat the Great Depression. In response to this problem, the Department of Commerce commissioned Nobel laureate Simon Kuznets to develop a set of “national accounts,” which eventually evolved into the modern concept of GDP.
Our ability to measure innovation is currently akin to where economists were on the question of GDP in the 1940s. Even the most reputable cross-national comprehensive innovation indices are still in their infancy. With such limited data, evaluating year-over-year trends is critical. Further, given that China’s rapid role transition in the global innovation ecosystem can in some ways serve as a metric for understanding the global innovation ecosystem overall , it is important to track China’s progression in as close to real-time as possible.
In the initial report for the China Innovation Policy Series (CIPS), The Fat Tech Dragon: Benchmarking China’s Innovation Drive (published in August 2017), we compared five indices to evaluate China’s innovation capacity in comparative perspective: the Bloomberg Innovation Index, the Chinese Ministry of Science & Technology’s National Innovation Index, the Global Competitiveness Index, the Global Creativity Index, and the Global Innovation Index (GII).
Compiled by the World Intellectual Property Organization (WIPO), INSEAD, and Cornell University, the GII is the most balanced of the five. Recently the GII’s 2017 data were issued, and so we can update on trends since our initial report. The data show that China’s effort to catch up is continuing apace.
The GII splits a country’s innovation capacity into “inputs,” (human capital and research, infrastructure, institutions, and market and business sophistication) and “outputs” (creative outputs, and knowledge & technology outputs). As Table 1 shows, of these seven metrics used to calculate a country’s GII per year, China’s 2017 GII ranking increased in every category except for one, market sophistication.
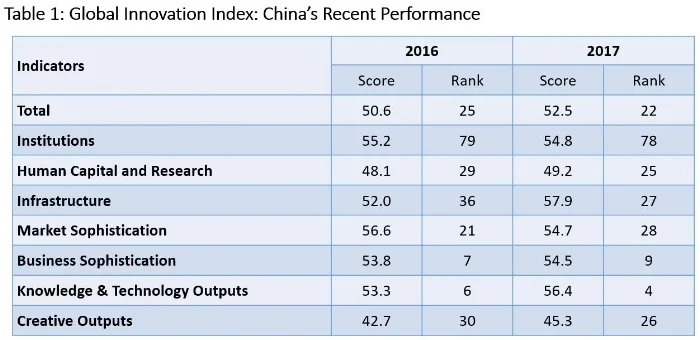
Source: Global Innovation Index
Furthermore, China’s absolute gains in 2017 are notable when compared to its relative gains over other countries in the region. For example, the ‘Top Six’ GII-rated countries in the Asia-Pacific formed an insular, exclusive group from 2011 to 2016. Singapore, Hong Kong, Japan, South Korea, Australia, and New Zealand switched their positions within the Top 6 leaderboard. But for the first time, in 2017, China ousted Australia to join the list at #6. In doing so, China became the first country to burst the ‘Top-6’ bubble in the Asia-Pacific region since the GII started to compare countries regionally in 2011.

Source: Global Innovation Index
In terms of global rankings, China’s performance in 2017 continues to stand out as an outlier from the developing world. China’s GII input has been pulling away steadily from comparably large, developing countries (such as Brazil and India) since at least 2011, with levels now approaching Germany, South Korea, Japan, and the United States. In terms of GII outputs, which includes creative outputs, knowledge, and technology, China’s steady gains relative to Japan, the United States, Germany, and South Korea continued.

Source: Global Innovation Index
Overall, China’s comparative gains over its more developed, regional neighbors Japan and South Korea is striking. In 2017, when isolating China, Japan, and South Korea, China ranks third in overall GII, Japan ranks second, and South Korea ranks first. But for the first time, the difference in absolute values of GII scores between third-ranked China (52.54) and second-ranked Japan (54.72) is smaller than the difference between Japan and South Korea (57.70). Though we shouldn’t make too much of this, it does show China is closing the innovation gap quickly.
Although we believe the GII is the most balanced of existing indices, it is not perfect and likely paints an overly rosy picture of China’s innovation capacity. The GII heavily weights inputs like engineering degrees, infrastructure and patents, for which China is particularly strong, but does not measure engineering students’ creative abilities, how infrastructure is linked to technology progress, or whether patents generate commercial value, all areas where China does not perform as well. Hence, we will continue to need to evaluate China using multiple indices as well as delve more deeply into the specifics of China’s actual experience. And perhaps through this effort we will eventually find even stronger measures of innovation that will help us get beyond the challenges faced in the 1940s by the early developers of comprehensive economic growth data.
Mr. Qiu Mingda is a Research Associate with the Freeman Chair in China Studies at CSIS.
Ms. Maria Sinclair is a Program Coordinator and Research Assistant with the Freeman Chair in China Studies at CSIS.
Click here for a printer friendly version.